Takt Time: Definition, Formula & How to Calculate It
How to calculate takt time and align production pace with real customer demand

Most factories that struggle with takt time aren't failing at the math, they're treating it as a theoretical number instead of an operational control. The result is the same either way: overproduction during low demand, missed deliveries during peak demand, and constant firefighting on the shop floor.
Takt time is not a KPI, it's a design constraint. It defines the exact pace at which a production system must operate to meet real customer demand using the available working time. Applied correctly, it becomes the backbone of flow, line balancing, capacity planning, and continuous improvement. Applied incorrectly, it creates false confidence and hidden bottlenecks.
This guide covers the correct definition of takt time, how to calculate it (including what time to exclude and why), how it differs from cycle time and lead time, real-world examples, and how modern digital tools monitor it in real time instead of on spreadsheets.
What is Takt Time?
Takt time is the maximum allowable time to produce one unit of product to meet customer demand. It sets the pace at which work must flow through your production line to satisfy customer orders without overproducing or falling behind.
The word "takt" comes from the German "taktzeit," meaning "cycle time" or "beat." Despite the linguistic overlap, takt time and cycle time are fundamentally different metrics, a distinction we cover in detail below.
Formally, takt time is the available production time divided by customer demand. It's a customer-driven metric calculated from actual demand rather than production capability, and it functions as:
- A planning target that prevents overproduction and underproduction
- A balancing tool that distributes work evenly across workstations
- A performance metric that reveals bottlenecks and capacity constraints
- A continuous improvement baseline that quantifies the gap between current and required performance
Takt Time Formula
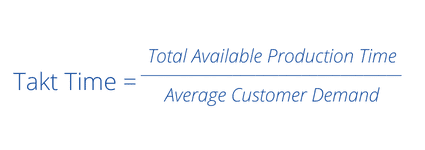 The fundamental takt time formula
Takt Time = Available Production Time ÷ Customer Demand
Two components need careful definition to calculate this accurately.
Available Production Time

This is the net time available for production during your planning period (typically one shift or day). It includes only planned production time, excluding scheduled breaks, lunch, shift changeovers, planned maintenance, and meetings, but not unplanned downtime like breakdowns.
For example: an eight-hour shift equals 480 minutes. Subtract a 10-minute break (470), a 20-minute lunch (450), and a 30-minute planned changeover (420). Available production time equals 420 minutes.
Organizations frequently overestimate available time by failing to account for all legitimate non-production activities, then face persistent schedule shortfalls when reality proves less generous than planning assumptions.
Customer Demand
Customer demand is the number of units customers require during your planning period, drawn from actual orders, forecasted demand, inventory-based production targets, or an average over weeks or months.
Using daily order quantities creates takt times that vary day to day, potentially requiring frequent line rebalancing. Averaging demand over longer periods creates more stable takt times but risks temporary overproduction or underproduction as actual demand fluctuates around the average. Most manufacturers use a hybrid: averaged demand for line design, with periodic adjustments for actual order patterns.
Step-by-Step Example
Using available production time of 420 minutes and customer demand of 210 units:
Takt Time = 420 minutes ÷ 210 units = 2.0 minutes per unit
Your production line must complete one unit every 2 minutes to meet demand. This establishes a maximum allowable cycle time: any operation taking longer than 2 minutes per unit will prevent the line from meeting demand unless compensated elsewhere or by added capacity.
Real-World Examples of Takt Time
Example 1: Automotive Parts Manufacturing
An automotive parts manufacturer produces brake assemblies during an eight-hour shift that includes a 30-minute lunch, 20 minutes of breaks, and a 10-minute changeover. Customer orders require 120 assemblies per shift.
Available production time: 480 − 30 − 20 − 10 = 420 minutes. Takt time: 420 ÷ 120 = 3.5 minutes per unit.
The line must complete one brake assembly every 3.5 minutes. At a 5-minute actual cycle time, production falls about 30% short (84 units instead of 120). At 3 minutes per unit, the line overproduces by 20 units, creating excess inventory. Cycle times significantly above takt time reveal capacity shortfalls; cycle times well below it suggest redeployable capacity or overproduction risk. Takt time sets the required pace; a run at rate verifies that the line can sustain it under real production conditions.
Example 2: Electronics Assembly (Multiple Shifts)
An electronics manufacturer runs two shifts producing circuit boards, with weekly demand of 2,400 units across five days. Each 8-hour shift allocates 40 minutes for breaks and 20 minutes for changeovers.
Available time per shift: 480 − 40 − 20 = 420 minutes. Weekly available time: 420 × 2 × 5 = 4,200 minutes. Takt time: 4,200 ÷ 2,400 = 1.75 minutes per unit.
Calculating per-shift instead (240 units/shift ÷ 420 minutes) yields the same 1.75 minutes per unit, showing the calculation holds regardless of the time horizon you choose, as long as it matches your planning cycle.
Example 3: Variable Product Mix
For lines running multiple models, takt time is calculated as a weighted average: total available time divided by total unit demand across all models. A line with 450 minutes available and combined demand of 180 units (across three models) has an average takt time of 2.5 minutes per unit. Manufacturers typically use level loading, sequencing models proportionally (e.g., A-A-B-A-A-C) rather than running large batches, to keep pace steady and surface quality issues sooner.
Takt Time vs. Cycle Time vs. Lead Time: Comparison Matrix
| Feature | Takt Time | Cycle Time | Lead Time |
|---|---|---|---|
| Fundamental Meaning | The "Target Pace." The rate required to satisfy the customer. | The "Actual Speed." The time it takes to perform the work. | The "Wait Time." The total duration a part spends in the system. |
| Formula | Available Production Time ÷ Customer Demand | Time to complete one unit of work | Order completion time – Order placement time |
| What it Includes | Only net available production time (no breaks). | Loading, processing, unloading, and reset time. | Processing time + Queue time + Shipping + Delays. |
| Operational Focus | Planning: How many people or machines do we need? | Efficiency: How can we make this specific task faster? | Responsiveness: How quickly can we turn an order into cash? |
| Management Signal | If this changes, you must rebalance your production line. | If this is too high, you have a bottleneck at that station. | If this is too high, your inventory levels are likely bloated. |
In an ideal lean environment: Cycle Time should sit at roughly 90–95% of Takt Time, leaving a small buffer for minor interruptions without missing demand. Lead Time should stay as close as possible to the sum of your cycle times; if total cycle time is 1 hour but lead time is 10 days, 99% of the product's time in the system is pure waste.
Why Takt Time Matters in Manufacturing
Synchronizing production with demand. Without takt time, production systems tend to run at maximum achievable speed regardless of actual demand, generating inventory during slow periods and shortages when demand rises. Calculating takt time correctly aligns production pace directly with order rate: when demand changes, takt time changes proportionally, triggering controlled adjustments instead of guesswork. This also caps overproduction: any output beyond the takt-time-derived rate is inventory the customer hasn't ordered yet, which is why pull-based systems use takt time as their replenishment signal.
Line balancing and capacity planning. Workstations with mismatched cycle times create bottlenecks: slow stations cause downstream waiting, fast ones cause upstream waiting, and both build up work-in-process that hides quality problems. Takt time gives every station the same target to balance against. For example, on a three-station line where Station 2's 3.5-minute cycle time bottlenecks Stations 1 (1.5 min) and 3 (2.0 min), rebalancing to a 2.5-minute takt time redistributes work so each station lands close to 2.3–2.4 minutes, and the bottleneck largely disappears. The same gap between current cycle time and takt time also quantifies staffing needs, equipment investment cases, and capacity expansion decisions.
Continuous improvement and safety. The gap between current cycle time and takt time gives kaizen and process-improvement efforts a concrete target: measure, find root causes, implement fixes, re-measure against takt time, repeat. It also protects quality and safety: production pushed to maximum speed rather than a sustainable, demand-matched pace tends to sacrifice quality checks and proper technique, and manufacturers moving to takt-time-based pacing typically see fewer defects and safety incidents as a result.
Implementing Takt Time Monitoring with FlowFuse
Understanding takt time in theory is one thing; putting it into practice requires the right tools. FlowFuse connects to your existing systems, whether PLCs, databases, or ERP software, to calculate takt time automatically in real time instead of on static spreadsheets. Before starting, create a FlowFuse account if you don't already have one.
Step 1: Connect to Your Data Sources
FlowFuse supports connections to industrial systems through its library of protocol and database nodes, pulling customer orders from your ERP system, production schedules from MES, and real-time counts from PLCs.
For this demo, simulate customer orders with an Inject node:
- Add an Inject node
- Configure the payload with this JSONata expression:
$round($random() * 50 + 50)
- Set it to trigger every 5 seconds
This simulates demand varying between 50 and 100 units.
Step 2: Calculate Available Production Time
- Add a Change node
- Use the following JSONata expression:
(8 * 60) - 60
This represents an 8-hour shift (480 minutes) minus 60 minutes for breaks and changeovers, leaving 420 minutes of available production time, the numerator in the formula.
Step 3: Automate Takt Time Calculation
- Add another Change node
- Configure it with this JSONata expression:
$round(($number(msg.payload.availableTime) / $number(msg.payload.customer_order)) * 100)/100
This applies the formula automatically, recalculating takt time with every new order.
Step 4: Create Real-Time Dashboards
- Install the FlowFuse Dashboard package via the Palette Manager (
@flowfuse/node-red-dashboard) - Use text widgets for a simple readout, or the Template widget for a custom display; FlowFuse AI can generate the code from a plain-English description
- Wire the Inject node into the available-time Change node, that into the takt-time Change node, and that into the UI Template node
- Deploy the flow and open the dashboard
Real-time takt time monitoring dashboard in FlowFuse
Here's the complete flow:
[{"id":"d5e580f48a9299a6","type":"inject","z":"c2c694c911f786fe","name":"Simulate Customer Order","props":[{"p":"payload.customer_order","v":"$round($random() * 50 + 50)","vt":"jsonata"}],"repeat":"5","crontab":"","once":false,"onceDelay":0.1,"topic":"","x":400,"y":300,"wires":[["518dbc1ac72f7c21"]]},{"id":"518dbc1ac72f7c21","type":"change","z":"c2c694c911f786fe","name":"Calculate total available time","rules":[{"t":"set","p":"payload.availableTime","pt":"msg","to":"(8 * 60) - 60","tot":"jsonata"}],"action":"","property":"","from":"","to":"","reg":false,"x":660,"y":300,"wires":[["3d35535dbb06fc86"]]},{"id":"3d35535dbb06fc86","type":"change","z":"c2c694c911f786fe","name":"Calculate Takt Time","rules":[{"t":"set","p":"payload","pt":"msg","to":"$round(($number(msg.payload.availableTime) / $number(msg.payload.customer_order)) * 100)/100","tot":"jsonata"}],"action":"","property":"","from":"","to":"","reg":false,"x":910,"y":300,"wires":[["de044b9204a9b248"]]},{"id":"de044b9204a9b248","type":"ui-template","z":"c2c694c911f786fe","group":"79d59adc1e8219b7","page":"","ui":"","name":"Display: Takt Time","order":1,"width":0,"height":0,"head":"","format":"<template>\n <v-sheet class=\"d-flex justify-center align-center led-background\" height=\"150\" elevation=\"4\" rounded>\n <div class=\"led-display\">\n {{taktTime}}\n </div>\n </v-sheet>\n</template>\n\n<script>\n export default {\n data() {\n return {\n taktTime: this.msg?.payload ?? '00:00.0'\n }\n },\n watch: {\n msg(newMsg) {\n if (newMsg?.payload) {\n this.taktTime = newMsg.payload;\n }\n }\n }\n}\n</script>\n\n<style scoped>\n .led-background {\n background: #0a0a0a;\n /* Dark black background */\n background-image: radial-gradient(circle, #111 1px, #0a0a0a 1px);\n background-size: 20px 20px;\n /* Carbon-like grid */\n }\n\n .led-display {\n font-family: 'Digital-7', monospace;\n font-size: 96px;\n color: #0f0;\n text-shadow:\n 0 0 5px #0f0,\n 0 0 10px #0f0,\n 0 0 20px #0f0,\n 0 0 30px #0f0;\n }\n</style>\n\n<!-- Include Digital-7 font from CDN -->\n<link href=\"https://fonts.googleapis.com/css2?family=Orbitron&display=swap\" rel=\"stylesheet\">","storeOutMessages":true,"passthru":true,"resendOnRefresh":true,"templateScope":"local","className":"","x":1110,"y":300,"wires":[[]]},{"id":"79d59adc1e8219b7","type":"ui-group","name":"Takt Time","page":"9b1c640ccc6a665e","width":6,"height":1,"order":1,"showTitle":true,"className":"","visible":"true","disabled":"false","groupType":"default"},{"id":"9b1c640ccc6a665e","type":"ui-page","name":"FlowFuse Dashboard","ui":"d44eab3a91dda8d9","path":"/","icon":"home","layout":"grid","theme":"2278e18670b606b7","breakpoints":[{"name":"Default","px":"0","cols":"3"},{"name":"Tablet","px":"576","cols":"6"},{"name":"Small Desktop","px":"768","cols":"9"},{"name":"Desktop","px":"1024","cols":"12"}],"order":1,"className":"","visible":"true","disabled":"false"},{"id":"d44eab3a91dda8d9","type":"ui-base","name":"My Dashboard","path":"/dashboard","appIcon":"","includeClientData":true,"acceptsClientConfig":["ui-notification","ui-control"],"showPathInSidebar":false,"headerContent":"page","navigationStyle":"default","titleBarStyle":"default","showReconnectNotification":true,"notificationDisplayTime":1,"showDisconnectNotification":true,"allowInstall":true},{"id":"2278e18670b606b7","type":"ui-theme","name":"Default Theme","colors":{"surface":"#2e073e","primary":"#0094ce","bgPage":"#eeeeee","groupBg":"#ffffff","groupOutline":"#cccccc"},"sizes":{"density":"default","pagePadding":"12px","groupGap":"12px","groupBorderRadius":"4px","widgetGap":"12px"}},{"id":"da2b78557435736b","type":"global-config","env":[],"modules":{"@flowfuse/node-red-dashboard":"1.27.2"}}]
Best Practices for Takt Time Implementation
- Accurate Data: Base calculations on actual production time, including breaks, changeovers, and realistic downtime, using real customer demand, and update regularly.
- Leadership Commitment: Leaders must support implementation visibly, allocate resources, and communicate the benefits clearly.
- Gradual Deployment: Start with a pilot line, train operators thoroughly, stabilize, and expand gradually rather than rolling out across all lines at once.
- Lean Integration: Combine takt time with value stream mapping, standardized work, and 5S to reduce waste and improve process capability.
- Visual Management: Use visible displays showing calculated takt time and production status at a glance so operators can react quickly.
- Problem Response: Establish escalation procedures, keep critical spares and maintenance nearby, and train operators in basic troubleshooting.
- Continuous Refinement: Review takt time regularly, track performance against it, and share lessons learned across deployments.
Conclusion
Takt time turns volatile customer demand into a precise, manageable production rhythm. The formula is simple (Available Production Time ÷ Customer Demand), but consistently applying it is what separates world-class operations from those stuck firefighting overproduction and missed deadlines. Manual tracking on spreadsheets tends to lag reality; platforms like FlowFuse give you the real-time visibility to monitor takt time, cycle time, and lead time automatically across your value stream.
Monitor Takt Time in Real Time
FlowFuse connects your production data to live dashboards so takt time updates automatically instead of on a spreadsheet.
Frequently Asked Questions
About the Author
Sumit Shinde
Technical Writer
Sumit Shinde is a Technical Writer at FlowFuse specializing in industrial automation and manufacturing. In the past three years, he has built industrial applications and authored more than 100 technical articles covering industrial connectivity, unified data architecture, production metrics, and quality management for modern manufacturing.
Like what you're reading?
Add FlowFuse as a preferred sourceOn the page that opens, check the box next to flowfuse.com to see more of our articles in your Google Search results.
Related Articles:
- Run at Rate: Proving Production Capacity Before Launch
- What Is SCADA? Supervisory Control and Data Acquisition
- Automotive Traceability: How Production Data Gets Tied to a Part
- Layered Process Audit (LPA): A Practical Guide + Checklist
- VDA 5050 Tutorial: Connect AGVs to Factory Systems over MQTT